Humanities Majors in the Professions and Other Occupations
- Data from the American Community Survey reveal that in 2018, over 4.5 million people employed in management, professional, and related occupations had a bachelor’s degree in the humanities (Indicator III-14a). Approximately 1.1 million graduates from the field were employed in various education positions, and over 900,000 humanities graduates worked as managers.
- Recipients of a bachelor’s degree in the humanities accounted for more than 10% of the college graduates employed in every occupational category except those that are specifically STEM-related (though even there they accounted for 4% of those in science/engineering jobs, 5% of graduates in healthcare jobs, and 7% of the graduates in computer occupations). Humanities graduates accounted for 20% or more of the college graduates in arts/design/entertainment/media, postsecondary teaching, legal, and museum/library jobs in 2018.
- From 1996 to 2008, according to data from the U.S. Census Bureau’s Survey of Income and Program Participation, approximately 6–8% of all noninstitutionalized U.S. civilians with medical degrees had an undergraduate degree in the humanities. Over the same time period, more than 20% of those with a law degree had been humanities majors as undergraduates (Indicator III-14b). (Note that these estimates cannot be compared directly to the shares reported in III-14a due to methodological and substantive differences between the two surveys. In particular, III-14a shows people actually working in each field, while the data in III-14b include all holders of medical and law degrees, whether or not they are working in the fields).
- In 2008, 22% of those holding an advanced degree in law (LL.B., J.D., and Ph.D.) had majored in humanities (down from the 2001 high of 28%; Indicator III-14c). This proportion was larger than that for any other academic field and would be even greater if students with bachelor’s degrees in history—which the Census Bureau treats as a social science—could have been included.
III-14a: Number and Share of Workers* with a Bachelor’s Degree who Majored in the Humanities, by Occupational Sector, 2018
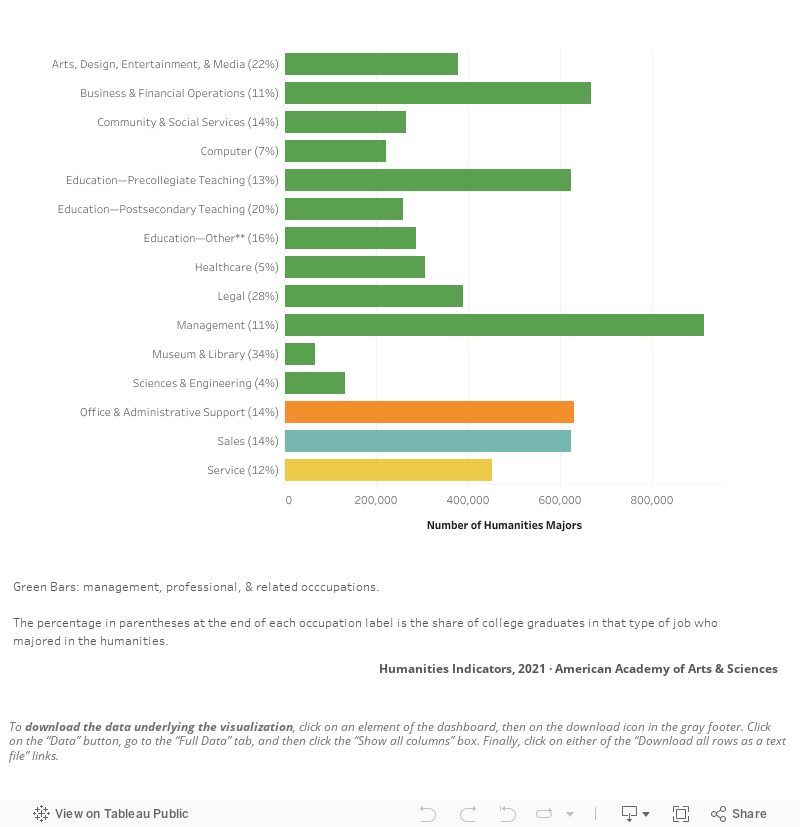
* Currently employed workers only. Respondents who worked more than one job at a time were asked to report the job at which they worked the most hours. For further details regarding the occupations included in each category used in the graph, see the ACS-HI Crosswalk.
** Includes education administrators, teaching assistants, tutors, school psychologists, and workers categorized by the U.S. Census Bureau as “other teachers and instructors.”
Source: U.S. Census Bureau, 2018 American Community Survey Public-Use Microdata Sample. Data analyzed and presented by the American Academy of Arts and Sciences’ Humanities Indicators (www.humanitiesindicators.org).
The information presented here on the occupations of college graduates who majored in the humanities is based on an original analysis by the Humanities Indicators (HI) of data from the American Community Survey (ACS), which has been administered by the U.S. Census Bureau since 2005.
The HI has chosen to focus its analysis not merely on the currently employed but on those college graduates who were employed at any time in the previous five years, because the objective of this indicator is to shed as much light as possible on what humanities majors go on to do in the way of paid employment and how this compares to the occupational outcomes of those who majored in other fields. To consider only the currently employed would be to lose information regarding, for example, the employment experiences of the recently retired or those who have temporarily exited the paid labor force to care for children or an elderly family member or to go back to school. Information regarding the occupations included in each category in the graph and specific degree programs grouped under each broad field heading is provided in the ACS-HI Crosswalk.
* Among the noninstitutionalized U.S. civilian population.
Source: U.S. Census Bureau, 1996–2008 Survey of Income and Program Participation (Education and Training History Module). Data analyzed and presented by the American Academy of Arts and Sciences’ Humanities Indicators (www.humanitiesindicators.org).
