Percentage of Humanities Departments Ceasing to Grant Degrees at Some Level, by Form of Institutional Control and Discipline, Fall 2007–Fall 2012*
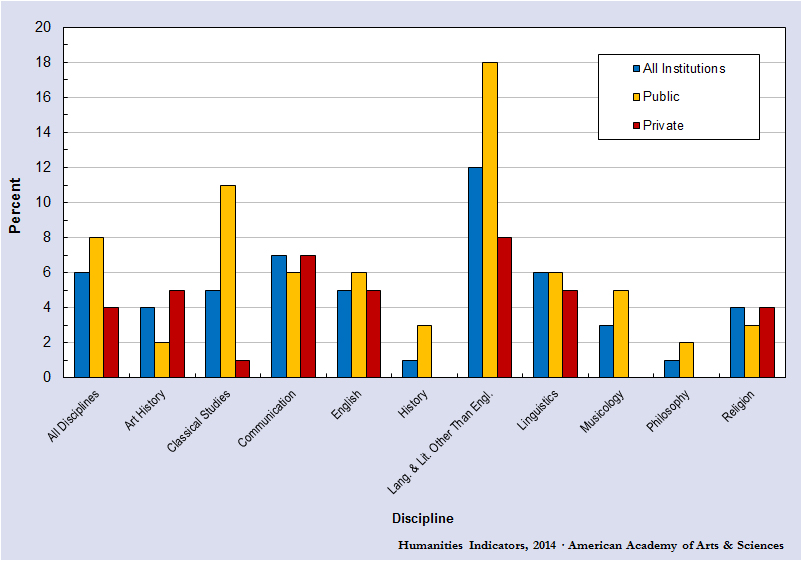
* History of Science and folklore were excluded from this graph because the estimate for every category of institution was either zero or of insufficient precision (the standard error associated with each estimate was more than 25% of the estimate's value). Combined departments were not included in this graph because there were too few respondents to provide a reliable estimates for every category of institution. (A combined department is one that grants degrees in English and also in languages and literatures other than English.)
Source: Susan White, Raymond Chu, and Roman Czujko, The 2012–13 Survey of Humanities Departments at Four-Year Institutions, Table 23, p. 32 (College Park, MD: Statistical Research Center, American Institute of Physics, 2014). Study conducted for the American Academy of Arts Sciences’ Humanities Indicators Project.
Source: Susan White, Raymond Chu, and Roman Czujko, The 2012–13 Survey of Humanities Departments at Four-Year Institutions, Table 23, p. 32 (College Park, MD: Statistical Research Center, American Institute of Physics, 2014). Study conducted for the American Academy of Arts Sciences’ Humanities Indicators Project.
Information on this site is meant to be used and shared. Feel free to copy, distribute, and transmit text and images from the Humanities Indicators, with attribution.
